Episodic ECHO-TTT
The one idea you need
Before answering four-way questions about an episode, the model gets a few seconds to cram, nudging four scratchpad tokens so it better predicts the observations it just saw. The test: does cramming on real observations beat cramming on scrambled or random text?
The question
If a small model spends a few seconds studying what it just saw in an environment, does that help it make better decisions right afterward?
What we found
No. Letting the model spend a few seconds studying an episode's real observations left its four-choice decisions stuck near blind-guess level, about 25%, no better than doing nothing. The tell: feeding it scrambled or nonsense text helped just as much, and the single best score across the whole experiment, 31%, came from studying nonsense. The study genuinely shifted the model, just not toward understanding the episode.
Why it matters
Before wiring quick per-episode self-study into a small-model agent, always run a scrambled-input control. If nonsense inputs shift the model as much as real ones, you are seeing generic warm-up, not real learning.
On this page
Results at a glance 7
How to read
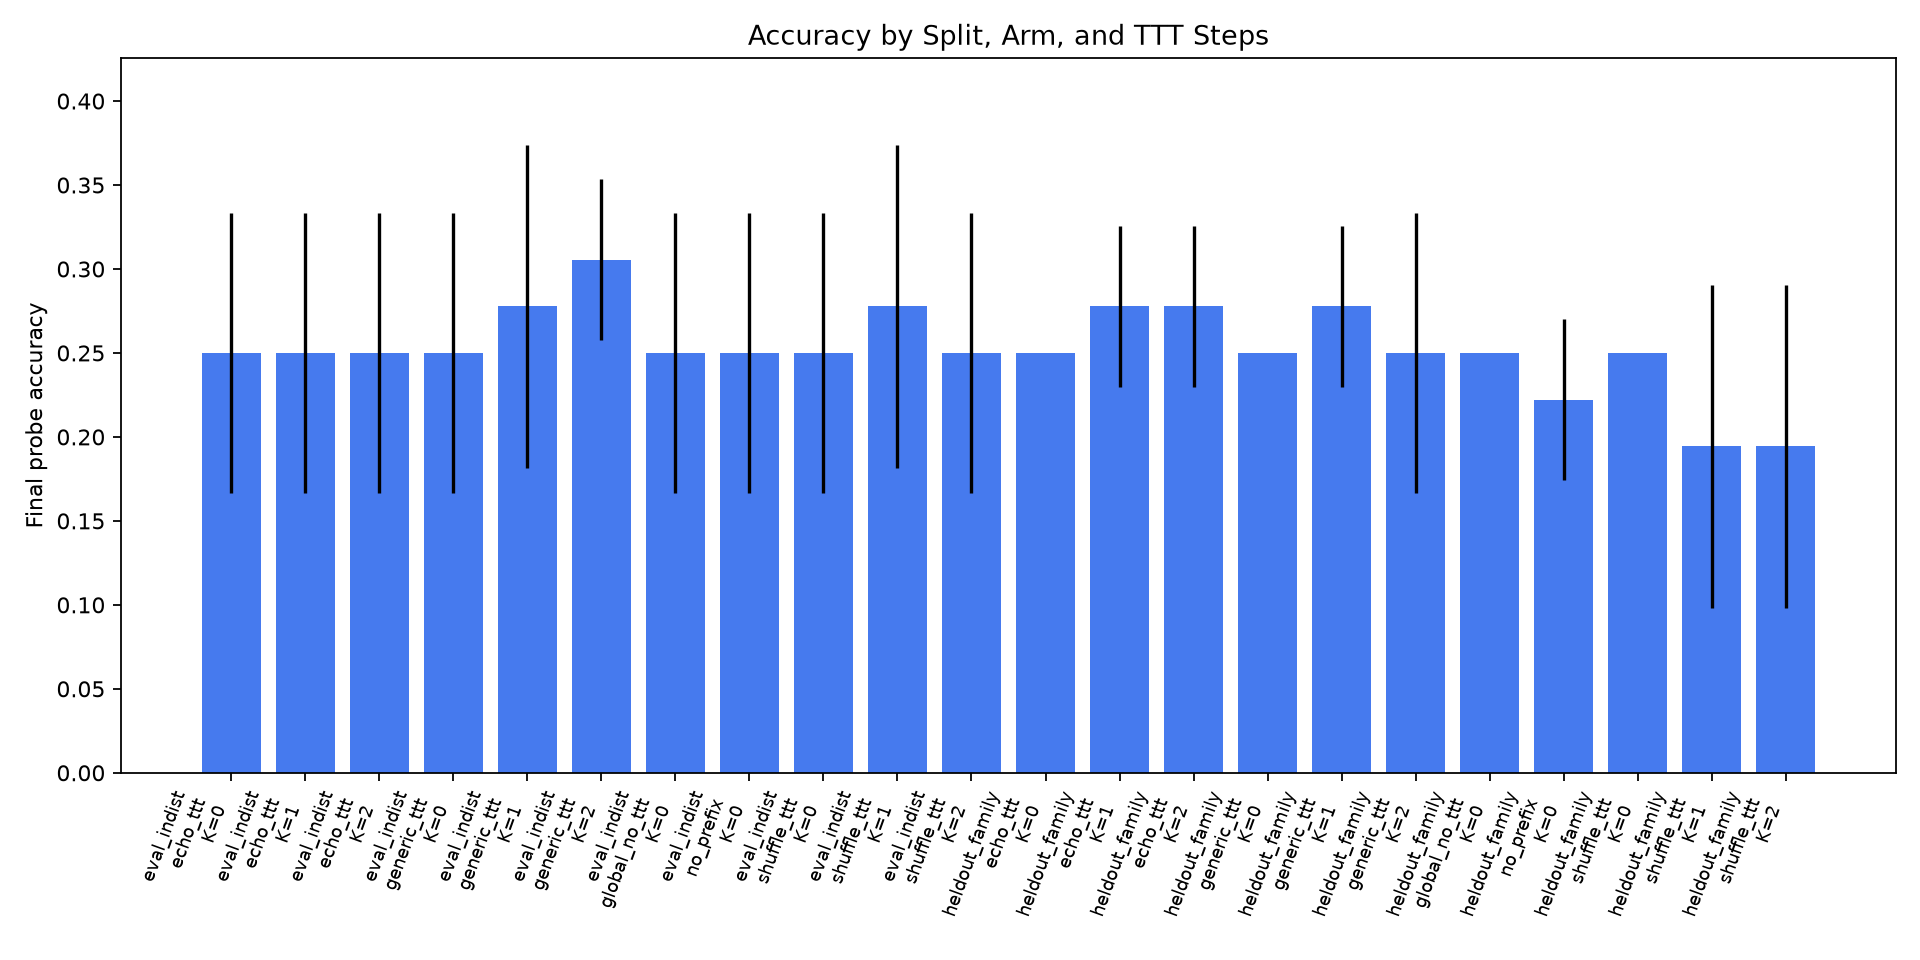
Bars show how often each version picked the right answer from four options; one color group is familiar episodes, the other is unfamiliar ones. Groups left to right: real-clue study, generic-text control, scrambled-clue control, no study. Higher is better; 25% is blind guessing.
Takeaway → Every bar hovers around the 25% guess line, and the tallest bar is a nonsense control, so studying the real clues earns nothing.
Data table
| Arm | in-distribution eval | held-out family |
|---|---|---|
| true-observation TTT | 25% | 27.8% |
| generic-text TTT (control) | 30.6% | 25% |
| shuffled-observation TTT (control) | 25% | 19.4% |
| no TTT | 25% | 25% |
Numbers from report table (reports/episodic_echo_ttt_report.md, Main Results)
Technical framing
Final-probe accuracy at 2 TTT steps: true observations vs corrupted controls — No arm separates from 25% four-choice chance; the best score (30.6%) is a corrupted control, so the mechanism fails its gate.
How to read
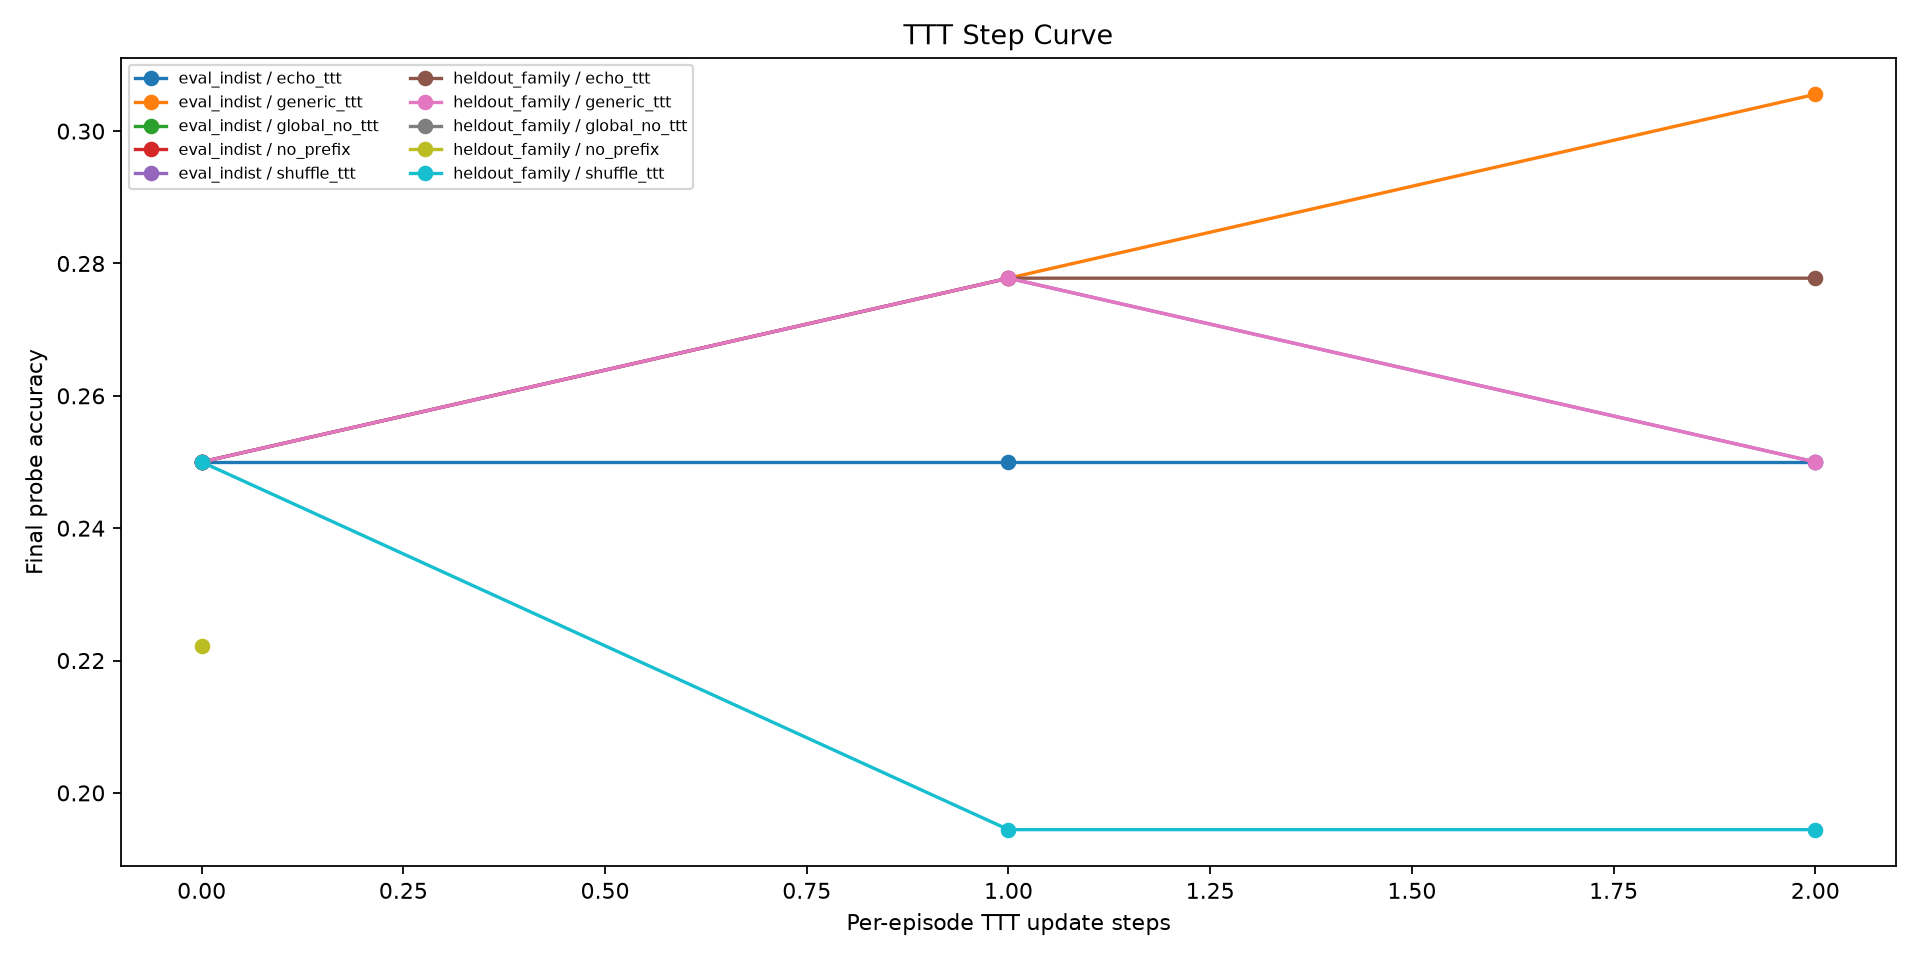
On familiar episodes, each line tracks accuracy as the model does more study rounds (left to right), one line per version plus a flat reference line at the 25% guess level. Higher is better.
Takeaway → The real-clue line sits flat on the 25% guess line, while only the generic-text control climbs, reaching 31% after two rounds.
Data table
| TTT steps | true-observation TTT | generic-text TTT (control) | shuffled-observation TTT (control) | chance |
|---|---|---|---|---|
| 0 | 25% | 25% | 25% | 25% |
| 1 | 25% | 27.8% | 27.8% | — |
| 2 | 25% | 30.6% | 25% | 25% |
Numbers from report table (reports/episodic_echo_ttt_report.md, Main Results)
Technical framing
Accuracy vs number of TTT steps (in-distribution eval) — More per-episode gradient steps never lift true-observation TTT above chance; the only gain shows up in a corrupted control.
How to read
On unfamiliar episodes, each line shows prediction error on unseen observations as study rounds increase; lower means the model guesses observations better. Lines are real clues, generic-text control, and scrambled-clue control.
Takeaway → All three lines fall by about the same amount, so studying the real clues reduces error no more than studying scrambled or generic text.
Data table
| TTT steps | true-observation TTT | generic-text TTT (control) | shuffled-observation TTT (control) |
|---|---|---|---|
| 0 | 6.17 | 6.17 | 6.17 |
| 1 | 5.48 | 5.57 | 5.47 |
| 2 | 5.46 | 5.38 | 5.4 |
Numbers from report table (reports/episodic_echo_ttt_report.md, Main Results)
Technical framing
Held-out observation cross-entropy after TTT (held-out family split) — TTT lowers held-out observation loss, but corrupted-observation updates lower it just as much, so the CE drop is not episode-grounded.
How to read
Grouped bars show accuracy after two study rounds for each of three independent training runs, colored by what was studied: no study, real clues, scrambled, or generic. Higher is better; 25% is blind guessing.
Takeaway → Only the first run shows the echo versions above chance; on the other two the arms sit at or below the 25% line (one control even dips to about 17%), so the apparent gains are run-to-run noise.
Data table
| Training seed | No TTT (global prefix) | True observations (echo) | Shuffled observations | Generic observations |
|---|---|---|---|---|
| Seed 101 | 25% | 33.3% | 8.3% | 33.3% |
| Seed 202 | 25% | 25% | 25% | 16.7% |
| Seed 303 | 25% | 25% | 25% | 25% |
Numbers from runs/main_episodic_echo_ttt_v1 via analysis/metrics.csv
Technical framing
Per-seed accuracy at 2 TTT steps (held-out family split) — Seed 101 drives all arm separation; seeds 202 and 303 sit at 25% chance, so apparent echo gains are within seed noise.
How to read
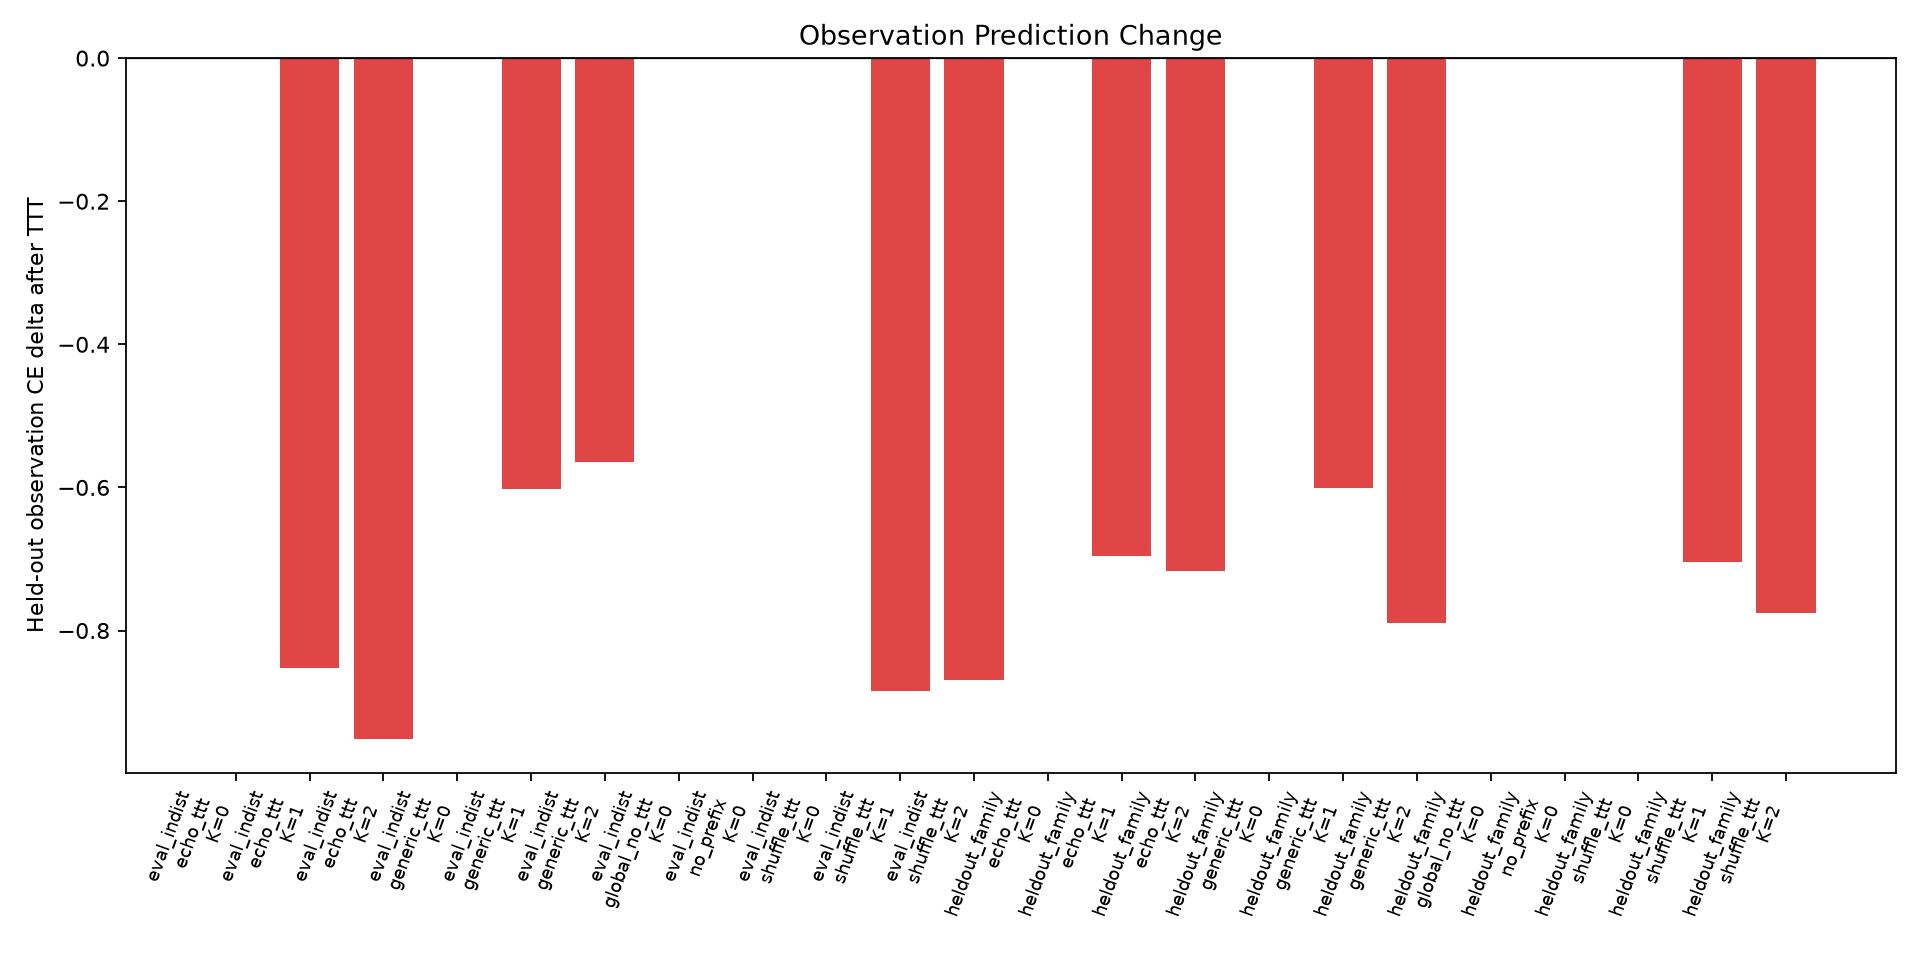
Bars show how far prediction error fell after two study rounds, split by content studied (real clues, scrambled, generic) and shown for both familiar and unfamiliar episodes. Bigger downward bars mean a larger error drop.
Takeaway → The scrambled and generic controls cut error about as much as the real clues, so the improvement is not tied to the true episode.
Data table
| TTT update content | In-distribution eval | Held-out family eval |
|---|---|---|
| True observations (echo) | -0.951 | -0.717 |
| Shuffled observations | -0.87 | -0.776 |
| Generic observations | -0.565 | -0.789 |
Numbers from analysis/summary_by_arm.csv
Technical framing
Held-out observation CE reduction after 2 TTT steps, by update content — Corrupted-observation updates cut held-out CE about as much as true ones, so the CE gain is not grounded in true episode dynamics.
How to read
Each line tracks accuracy as study rounds increase on episode types never seen during warm-up, one line each for real clues, scrambled, and generic content. Higher is better; 25% is blind guessing.
Takeaway → Real clues hover just around 25% while the scrambled control drifts below it, so no version reliably helps on unfamiliar episodes.
Data table
| TTT gradient steps | True observations (echo) | Shuffled observations | Generic observations |
|---|---|---|---|
| 0 | 25% | 25% | 25% |
| 1 | 27.8% | 19.4% | 27.8% |
| 2 | 27.8% | 19.4% | 25% |
Numbers from analysis/summary_by_arm.csv
Technical framing
Accuracy vs TTT steps on held-out families — On families never seen in prefix training, extra TTT steps leave echo near 25% chance while shuffled updates drift below it.
How to read
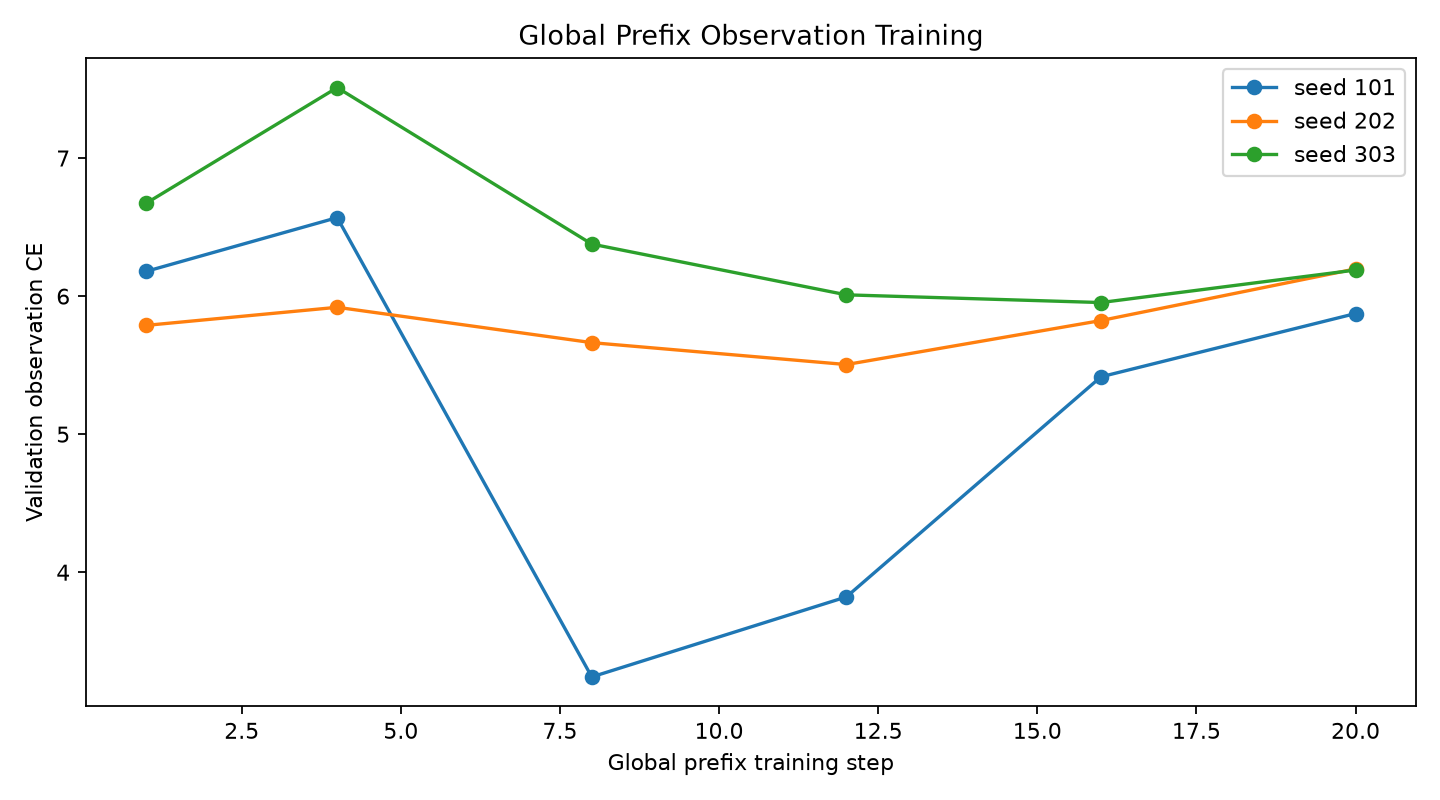
Each line tracks how wrong the model's observation guesses were over training steps, one line per training run; lower is better. There is no reference line.
Takeaway → The lines wobble up and down with no steady descent, with one run briefly halving its error mid-run before regressing back up, signaling an unstable warm-up setup.
Data table
| Training step | Seed 101 | Seed 202 | Seed 303 |
|---|---|---|---|
| 1 | 6.18 | 5.79 | 6.67 |
| 4 | 6.57 | 5.92 | 7.51 |
| 8 | 3.24 | 5.66 | 6.38 |
| 12 | 3.82 | 5.5 | 6.01 |
| 16 | 5.42 | 5.82 | 5.95 |
| 20 | 5.87 | 6.2 | 6.19 |
Numbers from analysis/training_log.csv
Technical framing
Global prefix training: validation observation CE by step — Global prefix training is unstable: seed 101 briefly halves validation CE mid-run then regresses, and no seed ends better than it started.
In the author’s words from the Report · “Summary”
Best mean accuracy was 30.6% for generic_ttt on eval_indist at 2 TTT steps. The primary comparison is global_no_ttt versus echo_ttt and the corrupted controls shuffle_ttt and generic_ttt. A real mechanism signal requires true-observation TTT to improve final-probe accuracy and held-out observation prediction more than corrupted-observation TTT. Gate readout at the largest tested TTT step: eval_indist at 2 TTT steps: echo 25.0%, no-TTT 25.0%, best corrupted control 30.6%. heldout_family at 2 TTT steps: echo 27.8%, no-TTT 25.0%, best corrupted control 25.0%.
Overview
This standalone experiment tests whether temporary per-episode gradient updates on environment-observation prediction improve later decisions in a small local language model.
Small experiment files live here. Large checkpoints and caches live under /workspace/large_artifacts/episodic_echo_ttt.
Main Artifacts
src/episodic_echo_ttt.py: experiment runner and report generator.experiment_log.md: chronological implementation and run log.runs/: metrics and metadata for each run.analysis/: aggregate CSVs and figures.reports/: Markdown and HTML reports.checkpoint_manifest.csv: pointers to large artifacts outside this directory.
Report
Rendered from reports/episodic_echo_ttt_report.md
Summary
This standalone experiment tests whether a frozen local language model can use temporary per-episode gradient updates on environment-observation prediction to make better later decisions.
Verdict: negative mechanism signal.
Best mean accuracy was 30.6% for generic_ttt on eval_indist at 2 TTT steps.
The primary comparison is global_no_ttt versus echo_ttt and the corrupted controls shuffle_ttt and generic_ttt. A real mechanism signal requires true-observation TTT to improve final-probe accuracy and held-out observation prediction more than corrupted-observation TTT.
Gate readout at the largest tested TTT step:
eval_indistat 2 TTT steps: echo 25.0%, no-TTT 25.0%, best corrupted control 30.6%.heldout_familyat 2 TTT steps: echo 27.8%, no-TTT 25.0%, best corrupted control 25.0%.
Setup
- Base model:
Qwen/Qwen3-4B. - Frozen model weights: yes.
- Per-episode trainable state:
4virtual prefix tokens. - Observation update target: only text spans containing diagnostic-box observations.
- Candidate decision: likelihood over four randomized option-letter continuations.
- Four-choice chance accuracy:
25.0%. - Support observations per episode:
5. - Held-out observation probes per episode:
2. - Seeds:
101,202,303. - Large artifacts:
/workspace/large_artifacts/episodic_echo_ttt.
Main Results
| split | arm | ttt_steps | n | mean_accuracy | std_accuracy | mean_obs_ce_before | mean_obs_ce_after | mean_obs_ce_delta |
|---|---|---|---|---|---|---|---|---|
| eval_indist | echo_ttt | 0 | 36 | 25.0% | 8.3% | 6.312 | 6.312 | 0 |
| eval_indist | echo_ttt | 1 | 36 | 25.0% | 8.3% | 6.312 | 5.46 | -0.852 |
| eval_indist | echo_ttt | 2 | 36 | 25.0% | 8.3% | 6.312 | 5.361 | -0.951 |
| eval_indist | generic_ttt | 0 | 36 | 25.0% | 8.3% | 6.312 | 6.312 | 0 |
| eval_indist | generic_ttt | 1 | 36 | 27.8% | 9.6% | 6.312 | 5.71 | -0.602 |
| eval_indist | generic_ttt | 2 | 36 | 30.6% | 4.8% | 6.312 | 5.747 | -0.565 |
| eval_indist | global_no_ttt | 0 | 36 | 25.0% | 8.3% | 6.312 | 6.312 | 0 |
| eval_indist | no_prefix | 0 | 36 | 25.0% | 8.3% | 6.398 | 6.398 | 0 |
| eval_indist | shuffle_ttt | 0 | 36 | 25.0% | 8.3% | 6.312 | 6.312 | 0 |
| eval_indist | shuffle_ttt | 1 | 36 | 27.8% | 9.6% | 6.312 | 5.428 | -0.884 |
| eval_indist | shuffle_ttt | 2 | 36 | 25.0% | 8.3% | 6.312 | 5.442 | -0.87 |
| heldout_family | echo_ttt | 0 | 36 | 25.0% | 0.0% | 6.174 | 6.174 | 0 |
| heldout_family | echo_ttt | 1 | 36 | 27.8% | 4.8% | 6.174 | 5.477 | -0.696 |
| heldout_family | echo_ttt | 2 | 36 | 27.8% | 4.8% | 6.174 | 5.457 | -0.717 |
| heldout_family | generic_ttt | 0 | 36 | 25.0% | 0.0% | 6.174 | 6.174 | 0 |
| heldout_family | generic_ttt | 1 | 36 | 27.8% | 4.8% | 6.174 | 5.573 | -0.6 |
| heldout_family | generic_ttt | 2 | 36 | 25.0% | 8.3% | 6.174 | 5.385 | -0.789 |
| heldout_family | global_no_ttt | 0 | 36 | 25.0% | 0.0% | 6.174 | 6.174 | 0 |
| heldout_family | no_prefix | 0 | 36 | 22.2% | 4.8% | 6.409 | 6.409 | 0 |
| heldout_family | shuffle_ttt | 0 | 36 | 25.0% | 0.0% | 6.174 | 6.174 | 0 |
| heldout_family | shuffle_ttt | 1 | 36 | 19.4% | 9.6% | 6.174 | 5.47 | -0.704 |
| heldout_family | shuffle_ttt | 2 | 36 | 19.4% | 9.6% | 6.174 | 5.398 | -0.776 |
Global Prefix Training
| seed | step | train_loss | val_obs_ce |
|---|---|---|---|
| 101 | 1 | 1.107 | 6.18 |
| 101 | 4 | 1.276 | 6.569 |
| 101 | 8 | 0.988 | 3.242 |
| 101 | 12 | 0.965 | 3.821 |
| 101 | 16 | 0.969 | 5.416 |
| 101 | 20 | 0.928 | 5.874 |
| 202 | 1 | 1.649 | 5.788 |
| 202 | 4 | 0.809 | 5.919 |
| 202 | 8 | 1.137 | 5.663 |
| 202 | 12 | 0.931 | 5.504 |
| 202 | 16 | 0.3 | 5.823 |
| 202 | 20 | 0.764 | 6.197 |
| 303 | 1 | 1.173 | 6.673 |
| 303 | 4 | 1.148 | 7.511 |
| 303 | 8 | 1.188 | 6.377 |
| 303 | 12 | 0.876 | 6.009 |
| 303 | 16 | 0.91 | 5.954 |
| 303 | 20 | 0.925 | 6.189 |
Interpretation
The load-bearing control is corrupted-observation TTT. The result does not pass that control. True-observation TTT reduces held-out observation CE, but shuffled and generic-observation updates also reduce CE on the same held-out probes. Final-probe accuracy remains near the four-choice chance level and does not separate reliably from the corrupted controls.
The experiment therefore supports a narrow negative conclusion for this tested recipe: a tiny virtual-prefix test-time update can move Qwen's likelihoods, but the movement is not specifically grounded in the true episode dynamics strongly enough to improve decisions.
Artifacts
- Run directory:
/workspace/experiments/episodic_echo_ttt/runs/main_episodic_echo_ttt_v1. - Metrics CSV:
/workspace/experiments/episodic_echo_ttt/analysis/metrics.csv. - Summary CSV:
/workspace/experiments/episodic_echo_ttt/analysis/summary_by_arm.csv. - Detail CSV:
/workspace/experiments/episodic_echo_ttt/analysis/detail_rows.csv. - Checkpoints:
/workspace/large_artifacts/episodic_echo_ttt/checkpoints/main_episodic_echo_ttt_v1.
Experiment log 5
Show the running log (5 entries)
Run smoke_episodic_echo_ttt_v1
- Started: 2026-06-26 03:48:57 UTC
- Suite:
smoke - Model:
Qwen/Qwen3-4B - Seeds:
101 - Arms:
no_prefix,global_no_ttt,echo_ttt,shuffle_ttt
Completed smoke_episodic_echo_ttt_v1 in 82.9s.
- Metric rows: 12
- Detail rows: 48
- Report:
reports/episodic_echo_ttt_report.md
Run pilot_episodic_echo_ttt_lr_v2
- Started: 2026-06-26 03:51:01 UTC
- Suite:
pilot - Model:
Qwen/Qwen3-4B - Seeds:
101 - Arms:
no_prefix,global_no_ttt,echo_ttt,shuffle_ttt,generic_ttt
Stopped during evaluation because candidate continuations were scored one forward pass at a time. The runner was patched to score all candidates for an episode in a single batch before the next pilot.
Run pilot_episodic_echo_ttt_batched_v3
- Started: 2026-06-26 03:54:19 UTC
- Suite:
pilot - Model:
Qwen/Qwen3-4B - Seeds:
101 - Arms:
no_prefix,global_no_ttt,echo_ttt,shuffle_ttt,generic_ttt
Completed pilot_episodic_echo_ttt_batched_v3 in 116.7s.
- Metric rows: 22
- Detail rows: 176
- Report:
reports/episodic_echo_ttt_report.md
Run smoke_episodic_echo_ttt_mc_v4
- Started: 2026-06-26 03:57:34 UTC
- Suite:
smoke - Model:
Qwen/Qwen3-4B - Seeds:
101 - Arms:
no_prefix,global_no_ttt,echo_ttt,shuffle_ttt
Completed smoke_episodic_echo_ttt_mc_v4 in 24.6s.
- Metric rows: 12
- Detail rows: 48
- Report:
reports/episodic_echo_ttt_report.md
Run main_episodic_echo_ttt_v1
- Started: 2026-06-26 03:58:38 UTC
- Suite:
main - Model:
Qwen/Qwen3-4B - Seeds:
101,202,303 - Arms:
no_prefix,global_no_ttt,echo_ttt,shuffle_ttt,generic_ttt
Completed main_episodic_echo_ttt_v1 in 336.0s.
- Metric rows: 66
- Detail rows: 792
- Report:
reports/episodic_echo_ttt_report.md
Figures 4
Data files 24
Result tables and metrics copied from the experiment folder — preview inline or open the raw file.
analysis/metrics.csv7.2 kBanalysis/summary_by_arm.csv2.4 kBruns/main_episodic_echo_ttt_v1/details_seed_101_eval_indist.csv21 kBruns/main_episodic_echo_ttt_v1/details_seed_202_eval_indist.csv19 kBruns/main_episodic_echo_ttt_v1/details_seed_303_eval_indist.csv19 kBruns/main_episodic_echo_ttt_v1/metrics_seed_101_eval_indist.csv1.3 kBruns/main_episodic_echo_ttt_v1/metrics_seed_101_heldout_family.csv1.3 kBruns/main_episodic_echo_ttt_v1/metrics_seed_202_eval_indist.csv1.3 kBruns/main_episodic_echo_ttt_v1/metrics_seed_202_heldout_family.csv1.2 kBruns/main_episodic_echo_ttt_v1/metrics_seed_303_eval_indist.csv1.2 kBruns/main_episodic_echo_ttt_v1/metrics_seed_303_heldout_family.csv1.2 kBruns/main_episodic_echo_ttt_v1/run_summary.json125 Bruns/pilot_episodic_echo_ttt_batched_v3/details_seed_101_eval_indist.csv14 kBruns/pilot_episodic_echo_ttt_batched_v3/metrics_seed_101_eval_indist.csv1.2 kBruns/pilot_episodic_echo_ttt_batched_v3/metrics_seed_101_heldout_family.csv1.2 kBruns/pilot_episodic_echo_ttt_batched_v3/run_summary.json134 Bruns/smoke_episodic_echo_ttt_mc_v4/details_seed_101_eval_indist.csv3.6 kBruns/smoke_episodic_echo_ttt_mc_v4/metrics_seed_101_eval_indist.csv630 Bruns/smoke_episodic_echo_ttt_mc_v4/metrics_seed_101_heldout_family.csv654 Bruns/smoke_episodic_echo_ttt_mc_v4/run_summary.json128 Bruns/smoke_episodic_echo_ttt_v1/details_seed_101_eval_indist.csv4.2 kBruns/smoke_episodic_echo_ttt_v1/metrics_seed_101_eval_indist.csv643 Bruns/smoke_episodic_echo_ttt_v1/metrics_seed_101_heldout_family.csv656 Bruns/smoke_episodic_echo_ttt_v1/run_summary.json124 B
Reproduce
The run commands are documented inside the experiment folder (see the README).